A Guide Built on our Experience with Ecobee and Best Buy
Retailers invest heavily in eye-catching displays to attract customers. However, a surprising number miss a crucial step: analyzing real data on how shoppers interact with them. But without data, how can you be sure your displays are truly effective?
Data Is Often A Missed Opportunity In Retail Displays In Physical Stores
A Consumer Goods study in 2023 revealed that 68% of retailers feel they are falling behind in analytics strategy. This means missed opportunities to improve the shopping experience, and boost sales. Darko helps brands and retailers solve this problem. Using a recent project as an example, we will share how to create displays that drive analytics and results.
Display Data Is Crucial For Success
In today's competitive retail landscape, data is the competitive edge that creates success.. When designing and implementing in-store displays, relying on gut feelings and assumptions is no longer enough. Savvy retailers are turning to data-driven decision-making to understand the behavior, preferences, and pain points of consumers.
This allows them to optimize store layouts, product placement, and promotional campaigns for maximum impact. By analyzing how shoppers interact with displays, retailers can identify what works, what doesn't, and ultimately, what drives conversions. This data-centric approach is essential for creating a shopping experience that resonates with consumers and delivers tangible results.
Learn From Our Expertise And Experience
We understand the power of data, and we're passionate about helping our clients harness it to achieve their goals. Our recent project serves as an example of how to effectively gather and utilize analytics to achieve results.
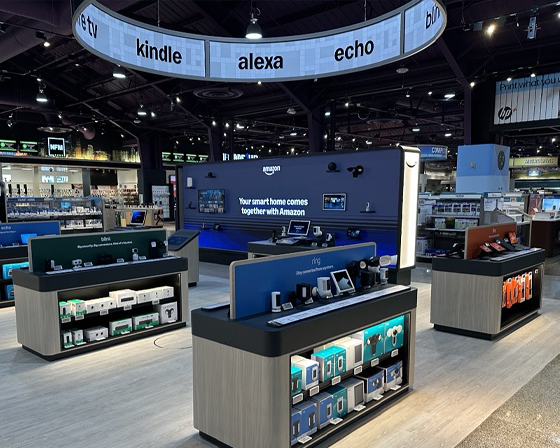
Ecobee, a leading smart home device manufacturer, partnered with Best Buy, a prominent electronics retailer. This team requested our services to create an engaging and data-driven in-store display.
We designed and implemented an interactive display experience that captured real-time shopper data. This valuable data provided insights into shopper behavior and product interest.
The results were significant: stores featuring the display outperformed those without in terms of year-over-year growth. This success highlights the power of in-store analytics in understanding shopper preferences, optimizing displays, and ultimately, driving sales.

The Power of In-Store Analytics
Get a Backstage Pass To Your Shoppers
Gathering in-store analytics is like having a backstage pass to the shopping journey of your customers. It provides invaluable insights into shopper behavior. The data shows what captures their interest, and what causes them to hesitate.
Data of this kind includes traffic flow patterns, dwell times, and interactions with specific displays. Retailers can optimize store layout and product placement to create a more intuitive and engaging shopping experience.
This data also allows you to measure the effectiveness of your visual merchandising and marketing campaigns. You benefit by having concrete evidence of what resonates with your target audience. Data insights enable you to make decisions that enhance the customer journey, improve efficiency, and drive sales growth.
Connect Behavior With Results
The beauty of in-store analytics lies in its ability to connect shopper behavior with tangible business outcomes. For instance, analyzing dwell times at specific displays can reveal which products generate the most interest. Knowing these products informs inventory management and promotional strategies to maximize sales. Understanding traffic flow patterns can help optimize store layout to encourage product discovery and reduce customer frustration, ultimately improving satisfaction.
By tailoring the shopping experience to customer preferences and behaviors, you foster a deeper connection with your brand. In-store analytics provides the knowledge to align your retail strategy with your overarching business objectives.
Key Metrics to Track
To truly understand the impact of your in-store displays and optimize their performance, you need to track the right metrics. These metrics can fit into broad categories: shopper engagement, dwell time and abandonment, shopper interests, and promotional impact. Depending on the specific goals of your retail display project, other relevant metrics might include foot traffic, or efficiencies.
Shopper Engagement
Shopper engagement metrics provide a valuable window into how customers interact with your displays. Touches, gestures, or button presses can reveal which elements of your display are most effective at capturing attention.
Video views and average viewing duration will show the level of interest in that particular message or product. Tracking the time shoppers spend interacting with a display (average session duration) indicates their level of engagement. This data can be instrumental in identifying areas for improvement and optimizing your displays to maximize interaction and interest.
Shopper Dwell Time and Abandonment
Dwell time (the time a shopper spends at a particular display) is a key indicator of interest and engagement. Longer dwell times often suggest a higher level of interest in the featured products or messaging.
This metric will help you identify which displays are most effective at capturing attention and which may need improvement. If shoppers consistently bypass a particular display, it might signal a need to re-evaluate its placement or messaging. Conversely, high dwell times can highlight successful elements to replicate in other store areas.
Equally important is understanding abandonment – when shoppers leave a display before engaging or purchasing. Abandonment rates can pinpoint areas where the shopping experience may fall short, undermining your business goals. You may discover that a display comes across as confusing or unclear. Analyzing abandonment data helps identify friction points in the customer journey, allowing you to make targeted improvements.

Shopper Interests
Understanding what piques shopper interest is crucial for tailoring your displays and overall retail strategy. Product interactions, such as the number of times an item is picked up, are valuable clues about shopper preferences. Video views and dwell time can shed light on which products, messages, or interactive elements are most engaging.
This granular level of insight into shopper interests is a goldmine for retailers. Knowing which products generate the most interest can inform decisions about product placement. It can also guide the development of more effective messaging and promotional strategies that resonate most with your audience. Ultimately, understanding shopper interests empowers you to create a more engaging and rewarding shopping experience that drives conversions and fosters customer loyalty.
Promotional Impact
Tracking metrics related to specific promotions is essential for understanding their impact on shopper behavior and sales. These include interactions with promotional displays, increased sales of promoted products, and even website traffic generated from QR codes. This shows which messaging drives the highest conversion rates, and which channels deliver the best return on investment.
To further refine your promotional strategies, consider employing A/B testing. This involves creating two versions of a promotional display. Each version has slight variations in elements like messaging, visuals, or call to action.
Compare the performance of each version and identify which elements are most effective at driving the desired results. This approach helps you optimize your promotions, ensuring that every campaign contributes to your business goals.
Additional Metrics
Several other data points can provide valuable insights for optimizing retail display projects. Time efficiencies related to display setup, maintenance, and updates can highlight areas for streamlining processes and reducing labor costs.
Similarly, tracking cost efficiencies associated with production, installation, and ongoing operation, such as leveraging remote updates for content changes, can lead to significant savings. Understanding the time it takes to bring a display concept to life allows brands to optimize future project timelines.
For brands focused on creating seamless customer experiences across channels, measuring the success of omnichannel integration is essential. Foot traffic data through sensor technology provides an understanding of a display's overall reach. These additional metrics help you optimize for maximum impact.
Analytics in Action: The Ecobee Example
To provide shoppers with an engaging and informative demo experience, we utilized interactive display capabilities to connect various Ecobee products. The benefit of this was twofold– a stronger experience for shoppers, and better analytics for our team.
The connected products showcased Ecobee's smart home ecosystem, allowing shoppers to explore the seamless integration and functionalities of different devices. We leveraged interactive display capabilities to track and report analytics on product usage and interactions. This approach enabled the team to optimize the display's performance. This in turn ensured that it effectively showcased Ecobee's products and resonated with the target audience.
Connecting Data to Insights:
Results in the Data
This Ecobee project with Best Buy generated valuable data, offering insights into shopper behavior and display performance. Several important pieces of intelligence became clear. Stores featuring Ecobee's focal displays saw higher year-over-year sales growth.
Engagement metrics were also impressive. The displays recorded 4,014 sessions and 13,736 video views in a month. Shoppers spent an average of 23 seconds per session.

The most popular interaction involved pushing the doorbell button. This triggered a live view on the Smart Thermostat Premium, underscoring shopper interest in this specific feature.
Interpreting the Data
This data provides several key insights to the team. The number of sessions and video views demonstrate significant shopper engagement with the Ecobee displays. The average session duration of 23 seconds offers a baseline for dwell time. Further analysis can pinpoint areas within the display that prolong or shorten engagement.
The year-over-year sales growth in stores with the displays confirms their positive promotional impact. Overall, the data collected provides compelling evidence of the display's effectiveness in engaging shoppers, driving interest, and ultimately contributing to increased sales.
Translating These Ideas Into Your Current Projects
Brainstorming Implementation Examples
Your Technology Selection
There are several ways to gather in-store analytics, each offering unique insights into shopper behavior. Sensors like infrared beams and motion detectors can track traffic flow and dwell time. This helps retailers understand customer movement and popular areas within the store. Cameras can track movement, and even identify emotions and engagement levels, providing a deeper understanding of shopper behavior.
Interactive displays, such as touch screens and kiosks, gather data on customer interactions and product preferences, offering insights into customer interests and product popularity.
Wi-Fi signals from smartphones can track movement patterns and dwell times, offering insights into customer behavior. Advanced computer vision technology can analyze customer behavior, demographics, and product interactions with greater detail.
Data Privacy and Transparency
While in-store analytics technology offers valuable insights, it's essential to prioritize data privacy and transparency. Transparency builds trust with shoppers, making them more likely to engage with displays and share information. Implementing security measures to protect shopper information from unauthorized access demonstrates a commitment to ethical data handling practices.
Integration with Existing Systems
To maximize the value of in-store analytics, integrate this data with your existing retail systems. Connect in-store analytics platforms with your point-of-sale system, for a comprehensive view of the customer journey. This integration provides insights into which displays and promotions are most effective at driving conversions.
Similarly, integrating with your CRM platform can enrich customer profiles with in-store behavioral data, enabling more personalized marketing campaigns and targeted promotions. This leads to more effective decision-making and improved business outcomes.
Turning Your Insights into Action
Optimization and Iteration
Using in-store analytics doesn't end with gathering data; it's an ongoing process of optimization and iteration. Analyze the data, glean insights, and use those to refine your displays and strategies.
This iterative approach is crucial for staying ahead of evolving shopper behaviors and preferences. This commitment is key to maximizing the effectiveness of your displays and achieving your retail goals.
Personalization and Targeting
In-store analytics can be a powerful tool for creating personalized shopping experiences. By understanding shopper behavior and preferences, you can tailor content, messaging, and even product recommendations to specific customer segments. Imagine a display that recognizes a shopper's loyalty status and greets them with personalized offers or exclusive content. This level of personalization enhances the shopping experience and fosters a deeper connection with your brand.
Measuring ROI
Demonstrating the value of in-store analytics is essential for securing buy-in and continued investment. Key metrics can quantify the impact of your efforts and demonstrate a clear return on investment. This data-driven approach helps justify your investment in display technology and showcases its effectiveness.

Integrate Technology and Utilize the Data You Gather
We’re Here To Help You Take The Next Step
Analytics are a necessity for those looking to thrive in the modern retail landscape. Businesses can understand shopper behavior, optimize displays, and measure campaign effectiveness. This turns in-store displays into powerful sales drivers and creates a more engaging and personalized shopping experience.
As technology evolves and shopper expectations rise, embracing a data-centric approach will be crucial. This competitive edge will help you stay ahead of the curve and achieve sustainable growth in the retail industry.
Ready to transform your in-store experience and drive meaningful results? Contact us today to leverage our expertise in innovative retail displays and data-driven strategies.